Telegraf/InfluxDB/Grafana Dashboard @home

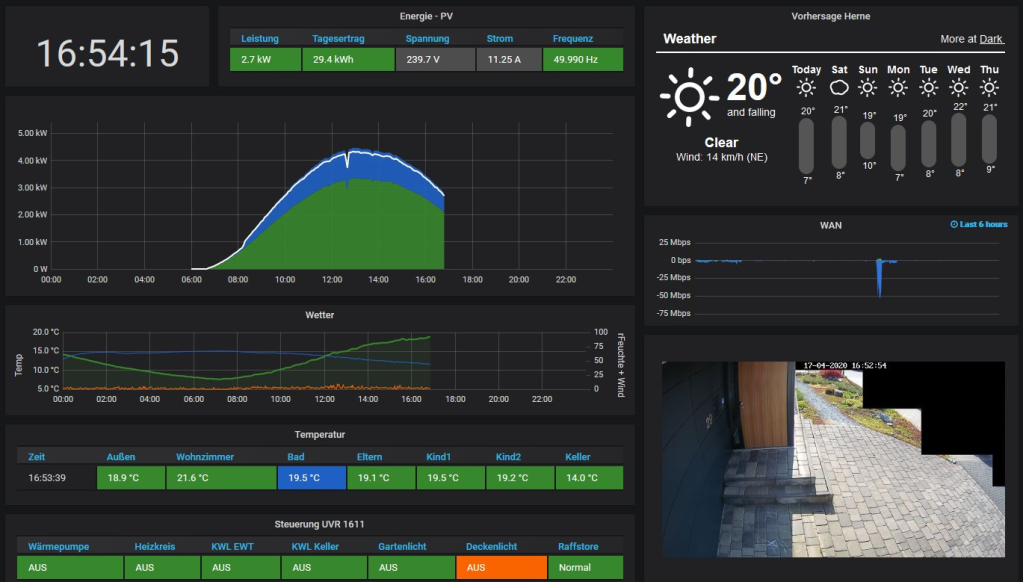
It seems that the TIG-Stack not only excels in the data center, but as a home automation UI as well – thanks to the versatile Telegraf input agent. Stock OEM display solutions often cost an arm and a leg, so I decided to build my own over a year ago. This post is about the hard- and software in use, as well as the necessary configuration to realize a useful dashboard system for your precious home.

Continue reading “Telegraf/InfluxDB/Grafana Dashboard @home”

Telegraf / InfluxDB / Grafana on RaspberryPi – From Scratch

Whether you are looking for a little test bed or an always-on home dashbording system, the RaspberryPi is a great, affordable platform for the TIG-Stack. So let’s ride through all the necessary steps ‘From Zero to Awesome’ in less than one hour.

Continue reading “Telegraf / InfluxDB / Grafana on RaspberryPi – From Scratch”

Monitor Cisco NX-OS/ACI via SNMP and the TIG-Stack

I know, even Cisco NX-OS has a REST-API and Streaming Telemetry these days.
But you, or established processes in your organisation, might find it helpful to handle all switch ‘Telemetry’ in the same way using good old per device SNMP polling. A quick poll* on the Twitters seems to validate that ~80% of production network metrics are still SNMP anyway.

*See what I did there?

Continue reading “Monitor Cisco NX-OS/ACI via SNMP and the TIG-Stack”

Monitor Cisco ACI via REST-API

Modern controller based networks are quite different from a monitoring perspective, all the fancy network abstraction information is hiding behind this thing called API. SNMP might still be there, but is missing most of the interesting bits like health scores, faults and Tenant/App/Policy based metrics. And sometimes your legacy ehm, established NMS has no clue how to query or interpret those programmable interfaces…

Continue reading “Monitor Cisco ACI via REST-API”

Automate your NOC World Map at scale

Managing hundreds of devices with your monitoring system might be a tedious task, especially when using GUI based device onboarding. But why not let your config management tool of choice take care of it? This blog post is about a declarative Ansible playbook to generate Telegraf configuration files leveraging the inputs.ping plugin and populate a Grafana World Map.

Continue reading “Automate your NOC World Map at scale”

Telegraf / InfluxDB / Grafana as syslog receiver

So you are using the TIG-Stack to visualize network device metrics like interface counters, CPU and memory already? Great, I think Grafana really excels in the dashboarding domain. But did you ever wonder, how to leverage the same solution to store and display syslog messages? Well, then this post is for you.

Continue reading “Telegraf / InfluxDB / Grafana as syslog receiver”